From Blue-Green Algae to Vibrio
2025
Design • Development • Cartography
During my 2025 vacation in Denmark, I found myself working with the sea professionally as well. Specifically: visualizing blue-green algae blooms in the Baltic from 2018 to 2025. For cloud-free days, data from the Sentinel-3 satellite was processed and analyzed. Using algorithms and AI models, the presence of algae blooms was identified. The data revealed that significant blooms occur even during peak swimming season, blooms that can pose health risks and trigger bathing bans. I built the map using the MapLibre framework on the frontend. On the backend, data was served via PMTiles to keep hosting simple and lightweight. I processed the raw data in QGIS: it came in raster format, which I converted into isolines and then smoothed out to get a visualization that feels both intuitive and visually clean. I also built a custom WebGL layer for MapLibre that renders bloom intensity as a dot density map, small black dots scattered across the water.
View Article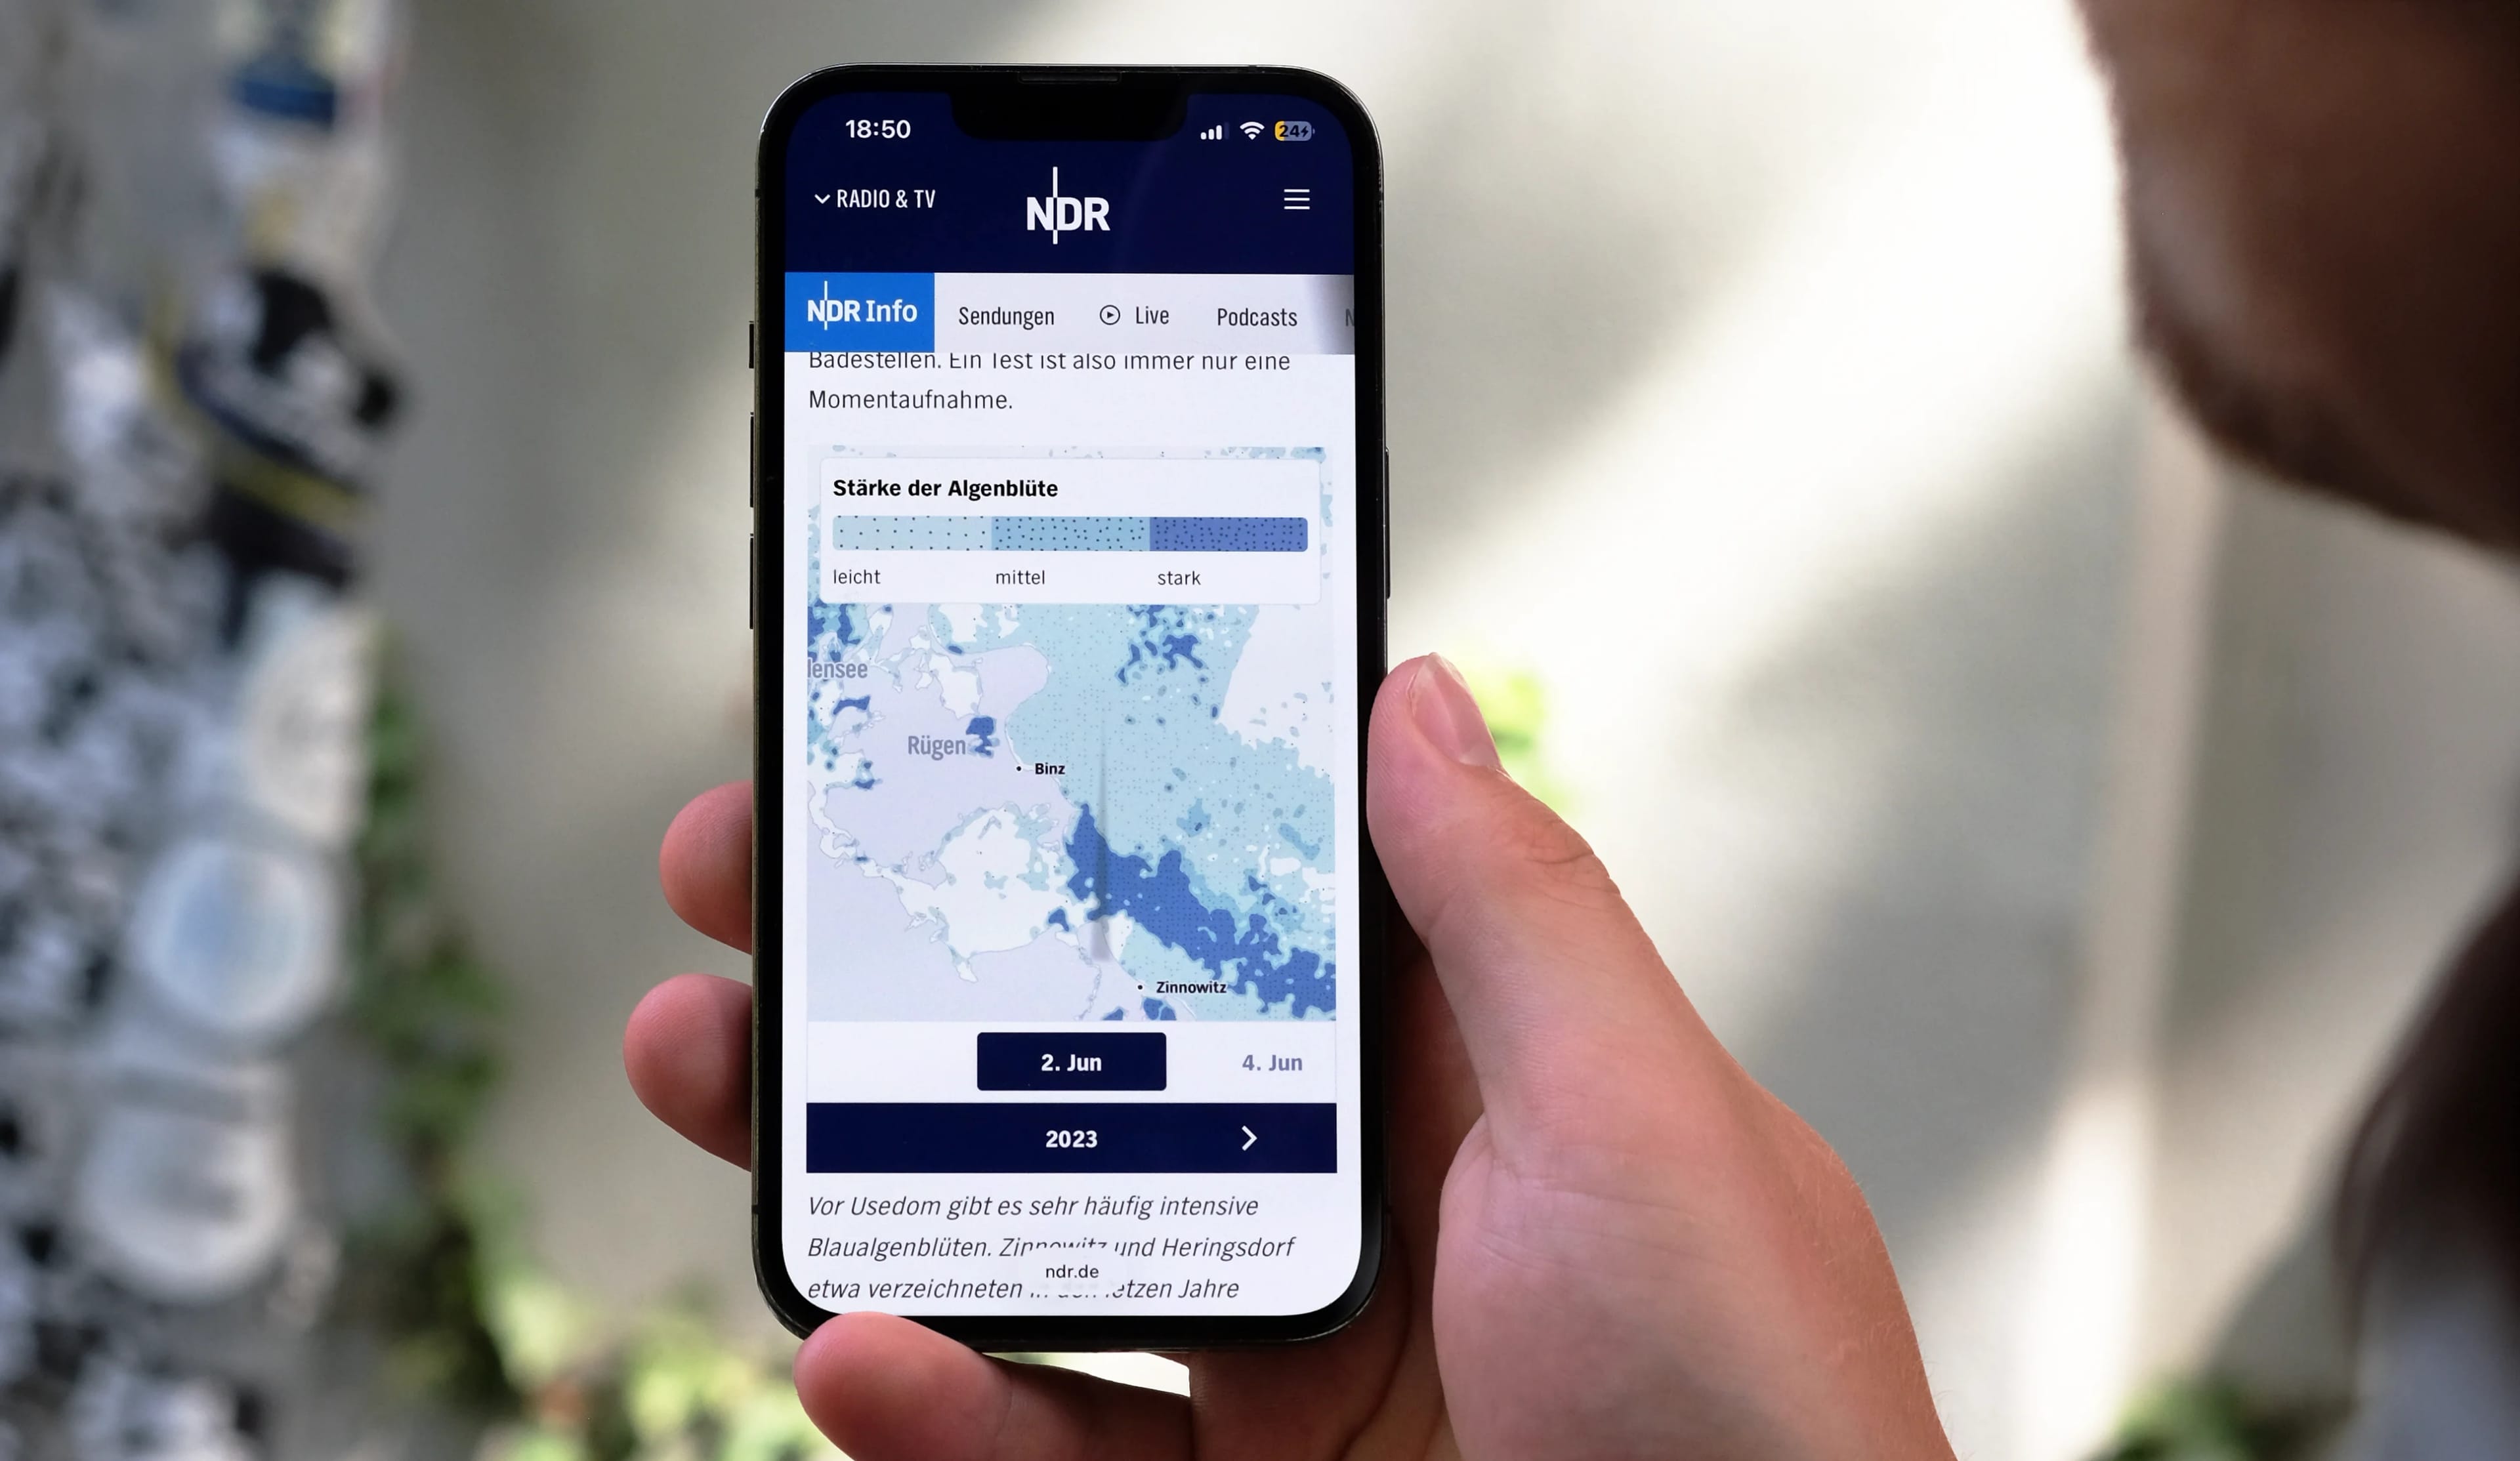
The blue-green algae visualization on the NDR website